Fintech
CLIENT:
Financial Expert
YEAR:
2025
MY ROLE:
Lead UX Designer

HSBC- AI Forecast Interest Rate


4 Goals of Redesign.
Dell Cart iteration.
Understand the issue from CSATS/ Vocaas.
With the insights gathered from stakeholders.
By gathering different solutions to clear define
problems. Test different solutions at a small
scale. Pick up the most potential solution.
About this project
Discover & Findings.
Goal 1
Reduce the distractions and frictions.
Help the customer reduce the cognitive load.
Goal 2
Reduce the exit rate. Increase the conversion rate.
The data shows that 80% of the customers quit
in Cart page when they start browsing existed
functions.
Goal 3
Help customers confirm the information of their
items. Find out the better price.
Due to multiple functions, the load time of Cart page
is around 4s.
Besides the back end changes. There should be
something can be done through UI perspective.
Goal 4
Provide more smoothly shopping path..


The Dell.com Cart & Checkout experience is a critical
part of Dell’s e-commerce platform, requiring
specialized design and technical expertise.
The goal of this project was to create a seamless,
secure, and scalable online purchasing flow that
minimizes friction and increases conversion.
I applied a data-driven design approach—leveraging
user behavior insights and hypothesis testing—to
optimize the user journey and drive measurable
business outcomes.
About this project.
About this project.
About this project.
This interest rate curve tool is a key financial platform at HSBC, designed for financial analysts and portfolio managers to forecast interest rate trends by inputting key variables.
The goal of this project is to digitize analysts' offline forecasting processes. By applying machine learning, the tool enables users to generate more accurate and data-driven interest rate predictions. Analysts can also apply custom shocks and assumptions to refine the output and support better decision-making.
Requests & problem statement.
Requests & problem statement.
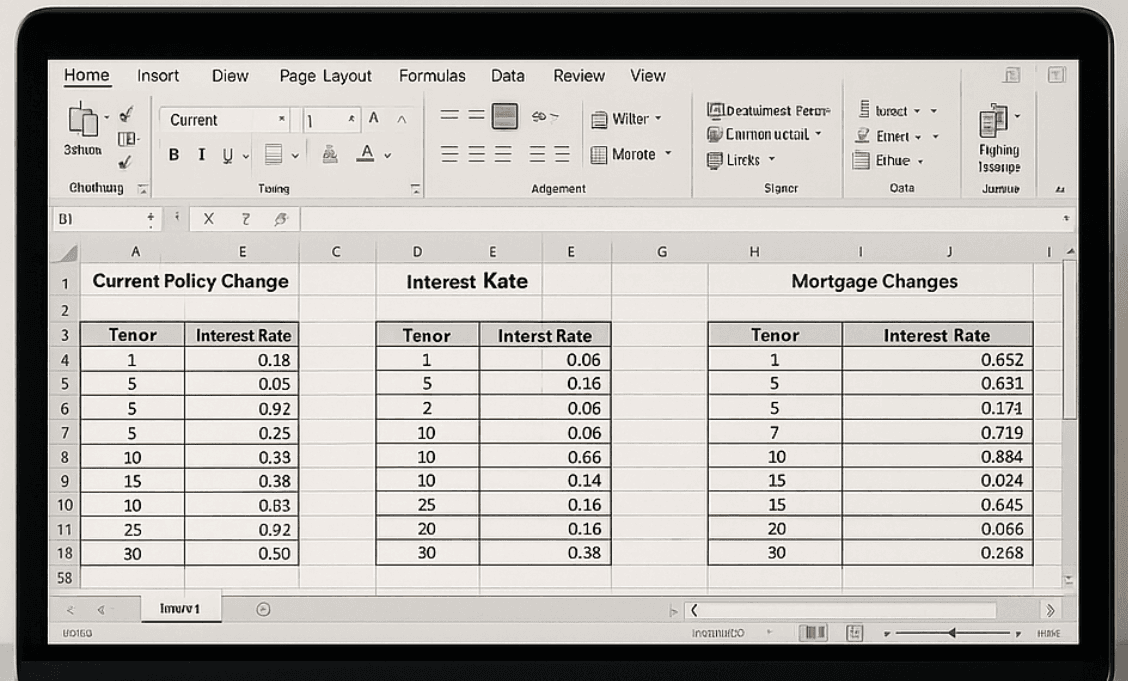
• Financial experts at the bank manually forecasted interest rate trends using numerous Excel files. These forecasts were based on a variety of macroeconomic scenarios, such as changes in monetary policy, inflation rates, or mortgage market conditions.
• The challenge was that all these predictions were siloed, inconsistent, and difficult to consolidate. The bank needed a centralized system to gather, align, and translate these forecasts into actionable interest rate curves that would:
- Attract customers to deposit funds (through competitive rates)
- Ensure the bank maintains profitability while minimizing risk exposure
IR curve in the Apex journey map.
Based on the current data & technical analysis, we prioritize the requirements into 3 phases
Phase1: Forcast IR curves
Phase2: Shock IR curves & forecast
Phase3: Upload IR curves

Phase 1: Forecast IR curves.
This diagram illustrates a neural network model designed to predict interest rate
curves using macroeconomic and market-related inputs. The input layer consists
of three key factors — Currency, Tenor, and Shocks — which are processed through
multiple hidden layers. The machine learning model captures nonlinear relationships
among these variables to output a forecasted Interest Rate Curve. This approach
enables more adaptive and data-driven modeling compared to traditional financial models.
Phase 1: Forecast IR curves.
This diagram illustrates a neural network model
designed to predict interest rate curves using
macroeconomic and market-related inputs.
The input layer consists of three key factors —
Currency, Tenor, and Shocks — which are
processed through multiple hidden layers. The
machine learning model captures nonlinear
relationships among these variables to output a
forecasted Interest Rate Curve. This approach
enables more adaptive and data-driven modeling
compared to traditional financial models.

About this project.
About this project.
This interest rate curve tool is a key financial platform at HSBC, designed for financial analysts and portfolio managers to forecast interest rate trends by inputting key variables.
The goal of this project is to digitize analysts' offline forecasting processes. By applying machine learning, the tool enables users to generate more accurate and data-driven interest rate predictions. Analysts can also apply custom shocks and assumptions to refine the output and support better decision-making.
Requests & problem statement.
• Financial experts at the bank manually forecasted interest rate trends using numerous Excel files. These forecasts were based on a variety of macroeconomic scenarios, such as changes in monetary policy, inflation rates, or mortgage market conditions.
• The challenge was that all these predictions were siloed, inconsistent, and difficult to consolidate. The bank needed a centralized system to gather, align, and translate these forecasts into actionable interest rate curves that would:
- Attract customers to deposit funds (through competitive rates)
- Ensure the bank maintains profitability while minimizing risk exposure
IR curve in the Apex journey map.
Based on the current data & technical analysis, we prioritize the requirements into 3 phases
Phase1: Forcast IR curves
Phase2: Shock IR curves & forecast
Phase3: Upload IR curves
The evolution of the Dell.com Cart page from 2020 (left) to 2023 (middle and right).
Phase 1: Forecast IR curves.
This diagram illustrates a neural network model designed to predict interest rate
curves using macroeconomic and market-related inputs. The input layer consists
of three key factors — Currency, Tenor, and Shocks — which are processed through
multiple hidden layers. The machine learning model captures nonlinear relationships
among these variables to output a forecasted Interest Rate Curve. This approach
enables more adaptive and data-driven modeling compared to traditional financial models.

Vocaas Feedback.

IR Curve end to end flow.


Phase 1: Design.
When designing the IR curve feature, one key challenge was how to present
multi-dimensional parameters in both table and chart views.
Initially, I explored using dropdowns to switch between different curves. However,
the business needed to view multiple curves side by side for easier comparison.
After several iterations, we aligned on a solution—a three-dimensional table structure
that allows users to compare interest rates across different tenors, curves, and as-of dates.


Phase 2: Shocks curves.
In the second phase of the design, we introduced the concept of "shocks"—a
feature that lets users adjust interest rate curves based on different scenarios.
The main challenge was displaying both the original and shocked curves, while
still allowing users to compare multiple versions. This added a fourth dimension
to the table, making it complex and potentially overwhelming.
To simplify the experience, I added an intermediate step: instead of showing all
data at once, the system first generates a summarized list of curves. Users can
then select which ones to compare or view in detail by checking the boxes.
Phase 2: Shocks curves
In the second phase of the design, we introduced the concept of "shocks"—a feature that lets users adjust interest rate curves based on different scenarios.The main challenge was displaying both the original and shocked curves, while still allowing users to compare multiple versions. This added a fourth dimension to the table, making it complex and potentially overwhelming.
To simplify the experience, I added an intermediate step: instead of showing all data at once, the system first generates a summarized list of curves. Users can then select which ones to compare or view in detail by checking the boxes.

What people say about me
“I’m thrilled to recommend Alice Bai, an outstanding UX designer whose user-centric approach and collaboration skills left a lasting impact on our team at Apex product delivery. As her line manager, I had the privilege of working closely with Alice and can confidently share for her expertise.
Alice has a rare talent for translating complex business requirement into intuitive, visually UX and UI designe solutions. Her mastery of user interview, wireframing, and interactive prototyping was instrumental in our strategic product delivery.
Beyond technical skills, Alice is an empathetic team player, she thrives in cross-functional environments, bridging gaps between design, engineering, and stakeholders with clarity and quality.”

First improvement.
Second improvement.

Third improvement.

Phase 1: Design.
When designing the IR curve feature, one key challenge was how to present
multi-dimensional parameters in both table and chart views.
Initially, I explored using dropdowns to switch between different curves. However,
the business needed to view multiple curves side by side for easier comparison.
After several iterations, we aligned on a solution—a three-dimensional table structure
that allows users to compare interest rates across different tenors, curves, and as-of dates.
Phase 2: Shocks curves.
In the second phase of the design, we introduced the concept of "shocks"—a
feature that lets users adjust interest rate curves based on different scenarios.
The main challenge was displaying both the original and shocked curves, while
still allowing users to compare multiple versions. This added a fourth dimension
to the table, making it complex and potentially overwhelming.
To simplify the experience, I added an intermediate step: instead of showing all
data at once, the system first generates a summarized list of curves. Users can
then select which ones to compare or view in detail by checking the boxes.


Fourth improvements.

User Testings.

AB Tests.

What People Say about me.

Result.
