Fintech
CLIENT:
HSBC
YEAR:
2024-2025
MY ROLE
Senior UX Designer
HSBC- AI Forecast Interest Rate
Challenges
Key Decisions

Full Story



There were several challenges.
First, the existing solution relied on a third-party legacy system, which cost millions of dollars every year. At the same time, it raised data security concerns, since sensitive interest rate data had to go through that external system. Second, the overall forecasting workflow was quite inefficient. It often took a long time for financial analysts to go through the process and get a final result.
The business team had a vision for how analysts would work with AI. Data science had a forecasting model, and engineering understood the technical constraints. But there was no end-to-end product experience connecting the model’s outputs to the decisions analysts needed to make.
We considered letting the AI model produce the final interest rate forecast automatically. It would have made the workflow faster and simpler, with fewer decisions for analysts to make in the interface.
Brainstorming with business stakeholders & Data Science
Data Mapping
Design Explorations
Design Goals
Data visualization • Table
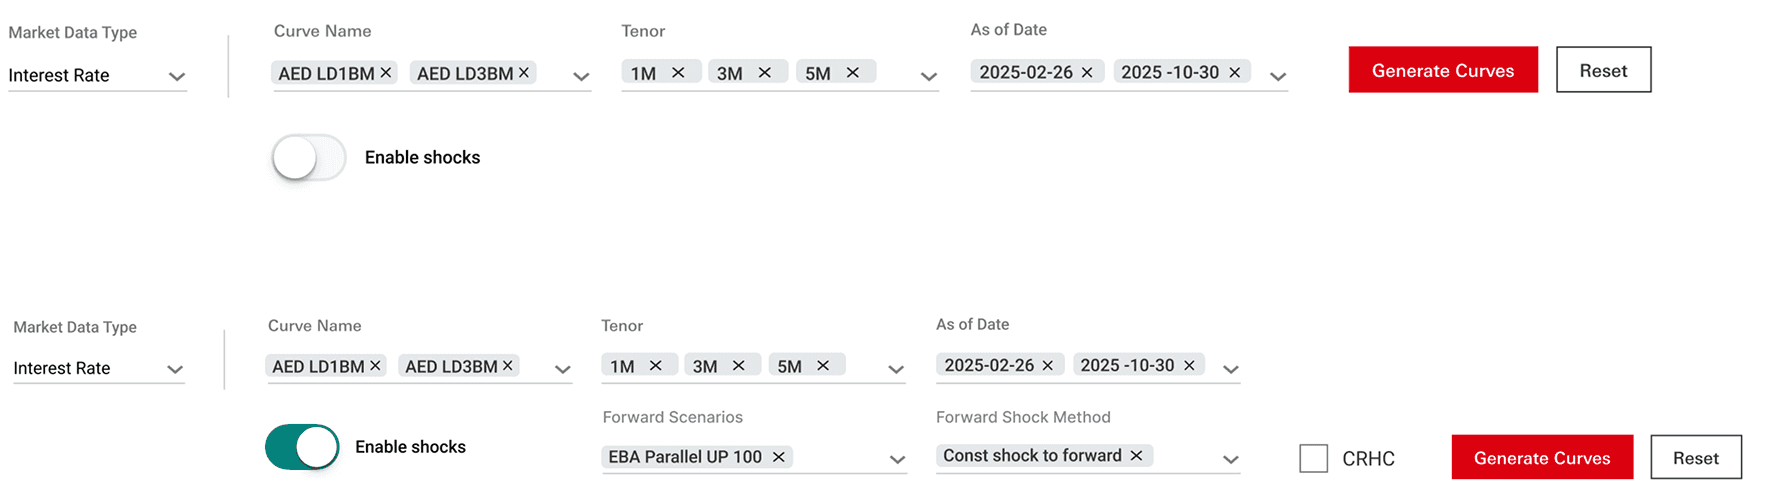
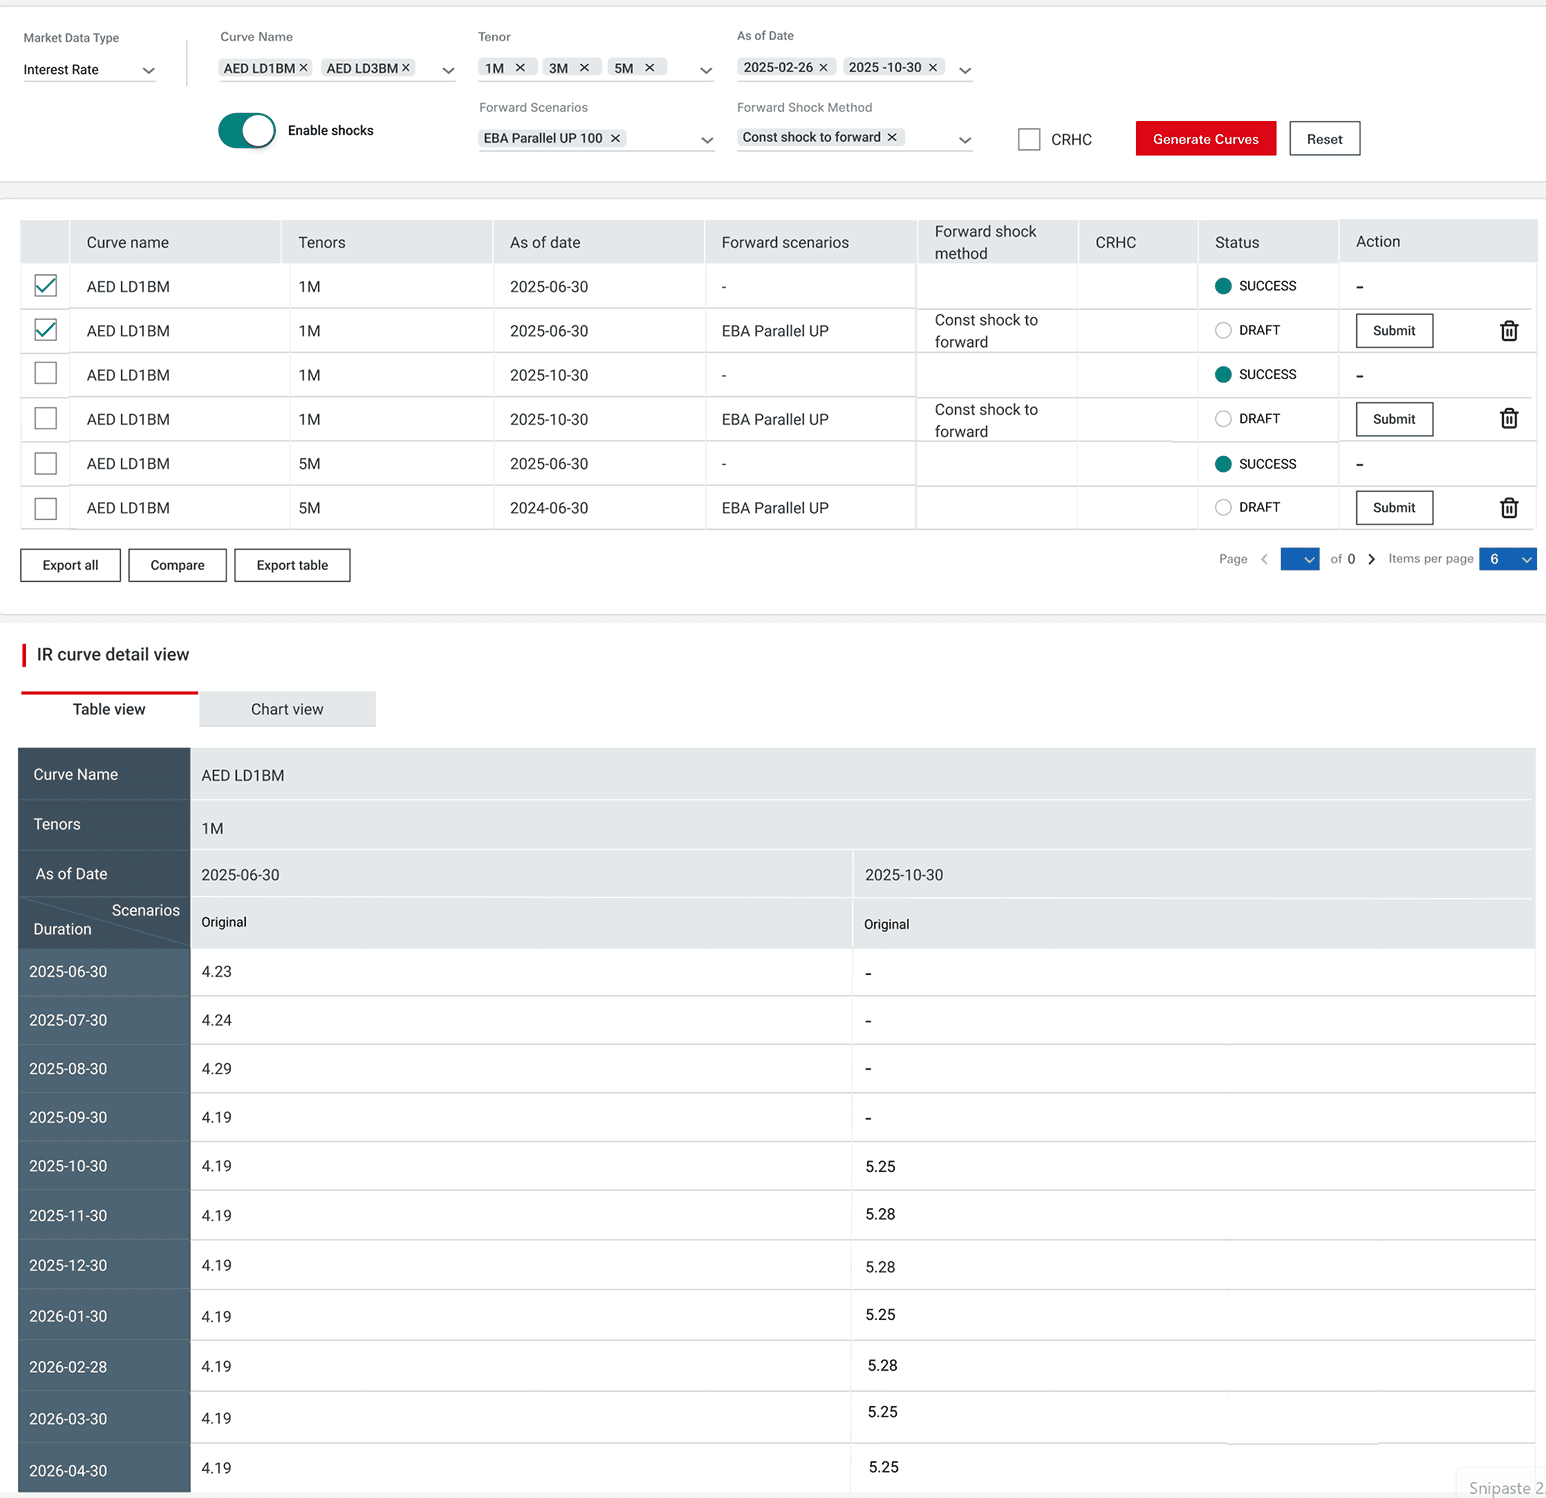
To support Calibration, I introduced an “Enable shocks” toggle that allows advanced users to calibrate and fine-tune AI-generated curves by adjusting scenarios and methods.
Design Goals
Discovery Workshop with business stakeholders
Review, Calibrate & Replace
User Flow for Advanced Users
Delivery result
Workflow impact

“I’m thrilled to recommend Alice Bai, an outstanding UX designer whose user-centric approach and collaboration skills left a lasting impact on our team at Apex product delivery. As her line manager, I had the privilege of working closely with Alice and can confidently share for her expertise.
Alice has a rare talent for translating complex business requirement into intuitive, visually UX and UI designe solutions. Her mastery of user interview, wireframing, and interactive prototyping was instrumental in our strategic product delivery.
Beyond technical skills, Alice is an empathetic team player, she thrives in cross-functional environments, bridging gaps between design, engineering, and stakeholders with clarity and quality.”

Manager feedback
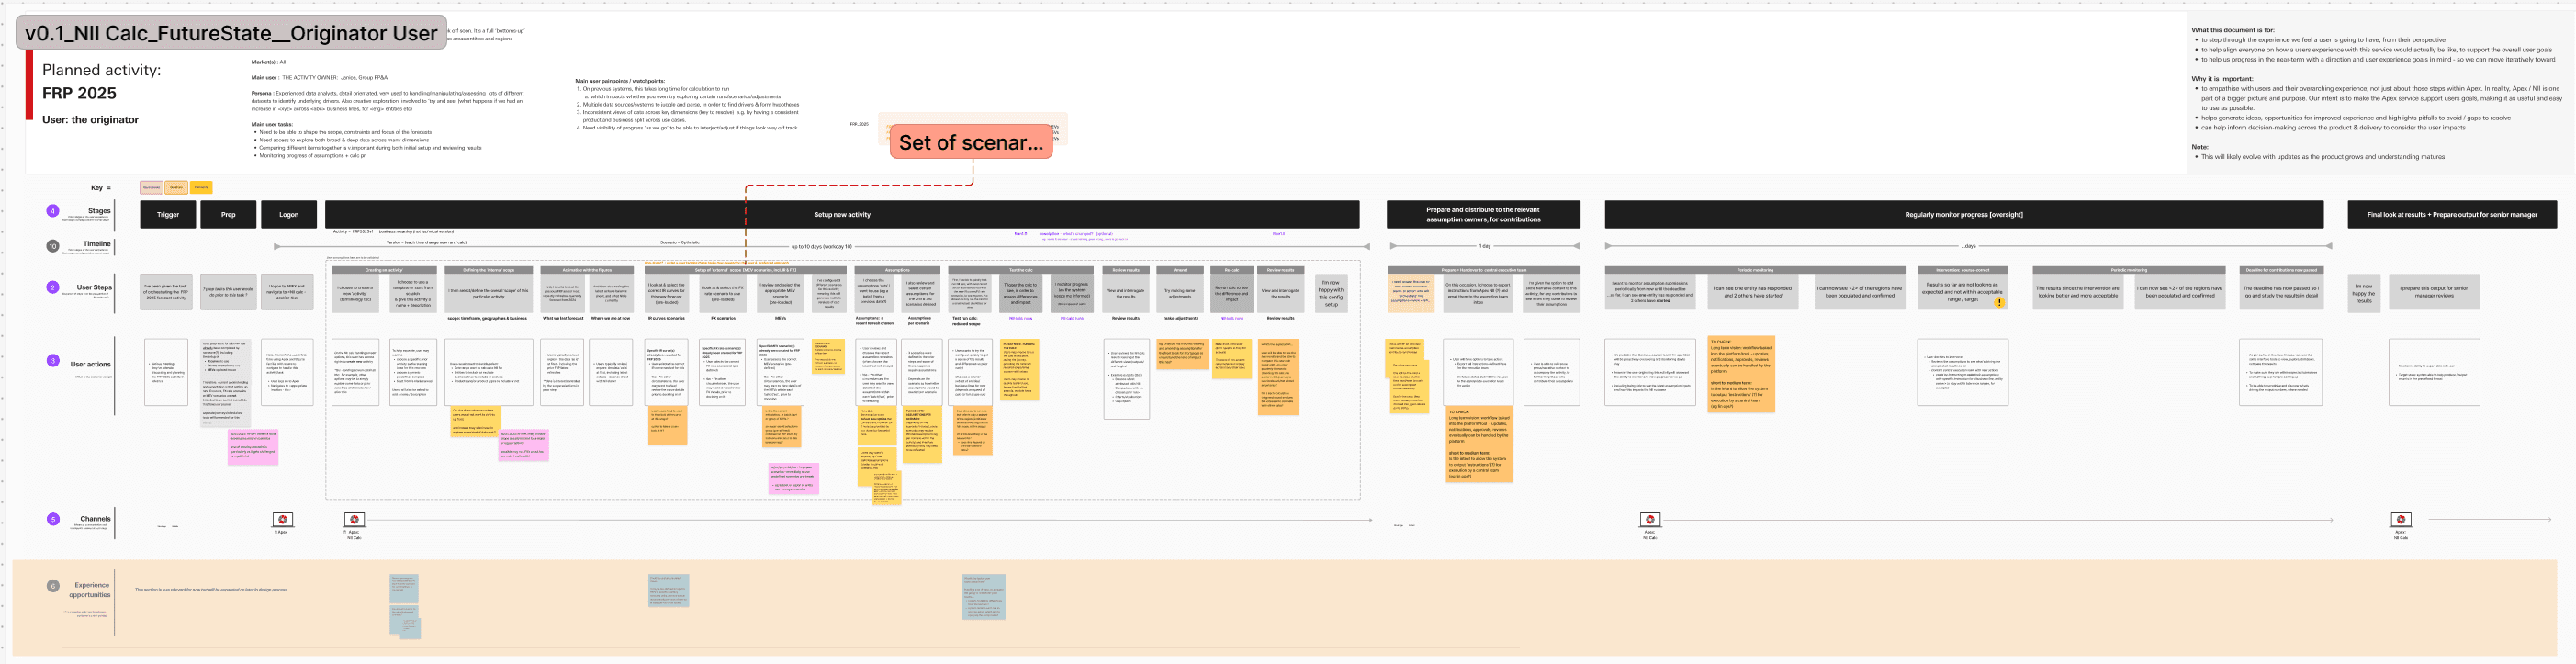
I started by gathering business insights, I facilitated a series of workshops with stakeholders using FigJam so that i can create journey map based on their expectation.
But a forecast can have significant consequences, and the model may miss recent market context or an analyst’s domain judgment. We chose to let AI generate the initial forecast, then give analysts a way to review it, compare scenarios, adjust it when needed, and make the final decision. This added steps, but kept the reasoning visible and the analyst accountable.
Once that high level interaction model was clear, I worked with business stakeholders to understand what analysts needed at each stage of the workflow.
In parallel, I worked with data science and engineering to understand what the model could actually generate, what data was available, and where the technical constraints were.
The main challenge was that the business expectations did not always map clearly to the model’s current capabilities, outputs, or backend data fields.
Stakeholders described the workflow in business language, but those concepts still needed to be translated into specific information, system behavior, and user actions.
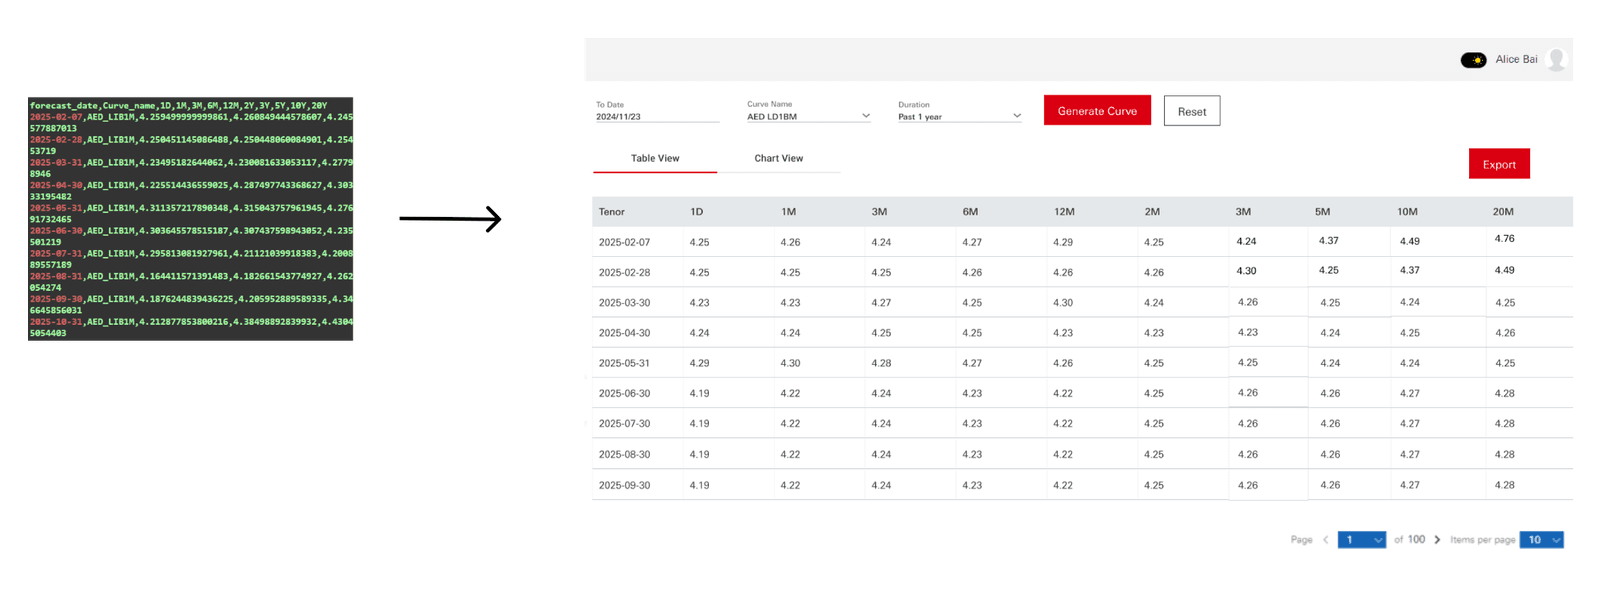
Rather than waiting for every requirement to be clarified, I created an early concept based on what we already knew and used it as a conversation starter.
Once stakeholders could see the draft workflow on screen, their feedback became much more concrete around what analysts needed to see, compare, validate, and adjust.
Based on that feedback, I defined three clear design goals: make the forecast easier to read, easier to compare, and easier to validate before the analyst made the final decision.
Context
The goal of this product was to help analysts forecast future interest rate trends more efficiently and make better decisions under uncertainty.
Challenge:
First, the existing Interest rate forecasting process relied on a third-party legacy system, which cost millions of dollars every year.
Second, the overall forecasting workflow was quite inefficient. It often took a long time for financial analysts to go through the process and get a final result.
Impact:
70% faster forecasting via automated AI workflows.
50+ data sources synthesized into a unified interaction model.
90% adoption rate among institutional analysts by designing for AI explainability.
My Role: Solo designer
UX design
Documentation
Design system
Team: Design team
Business team
Data Science team
Engineering team
Product Manager
About this Project
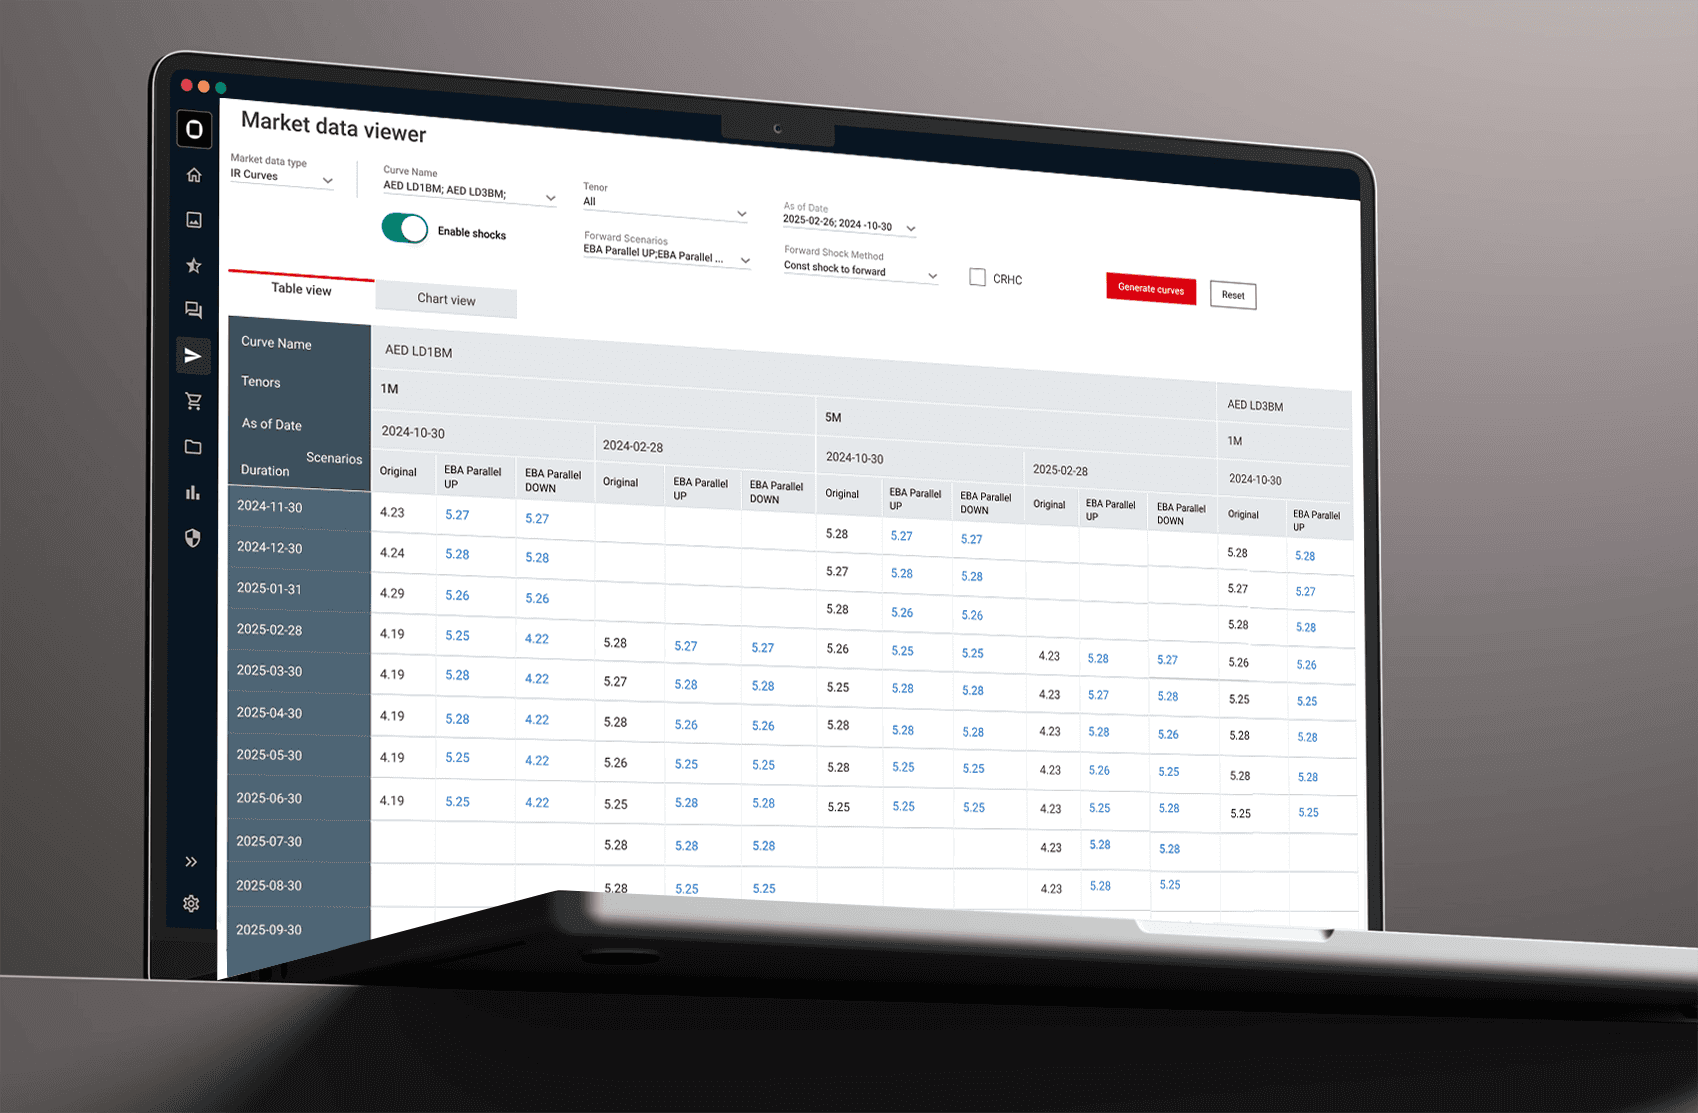
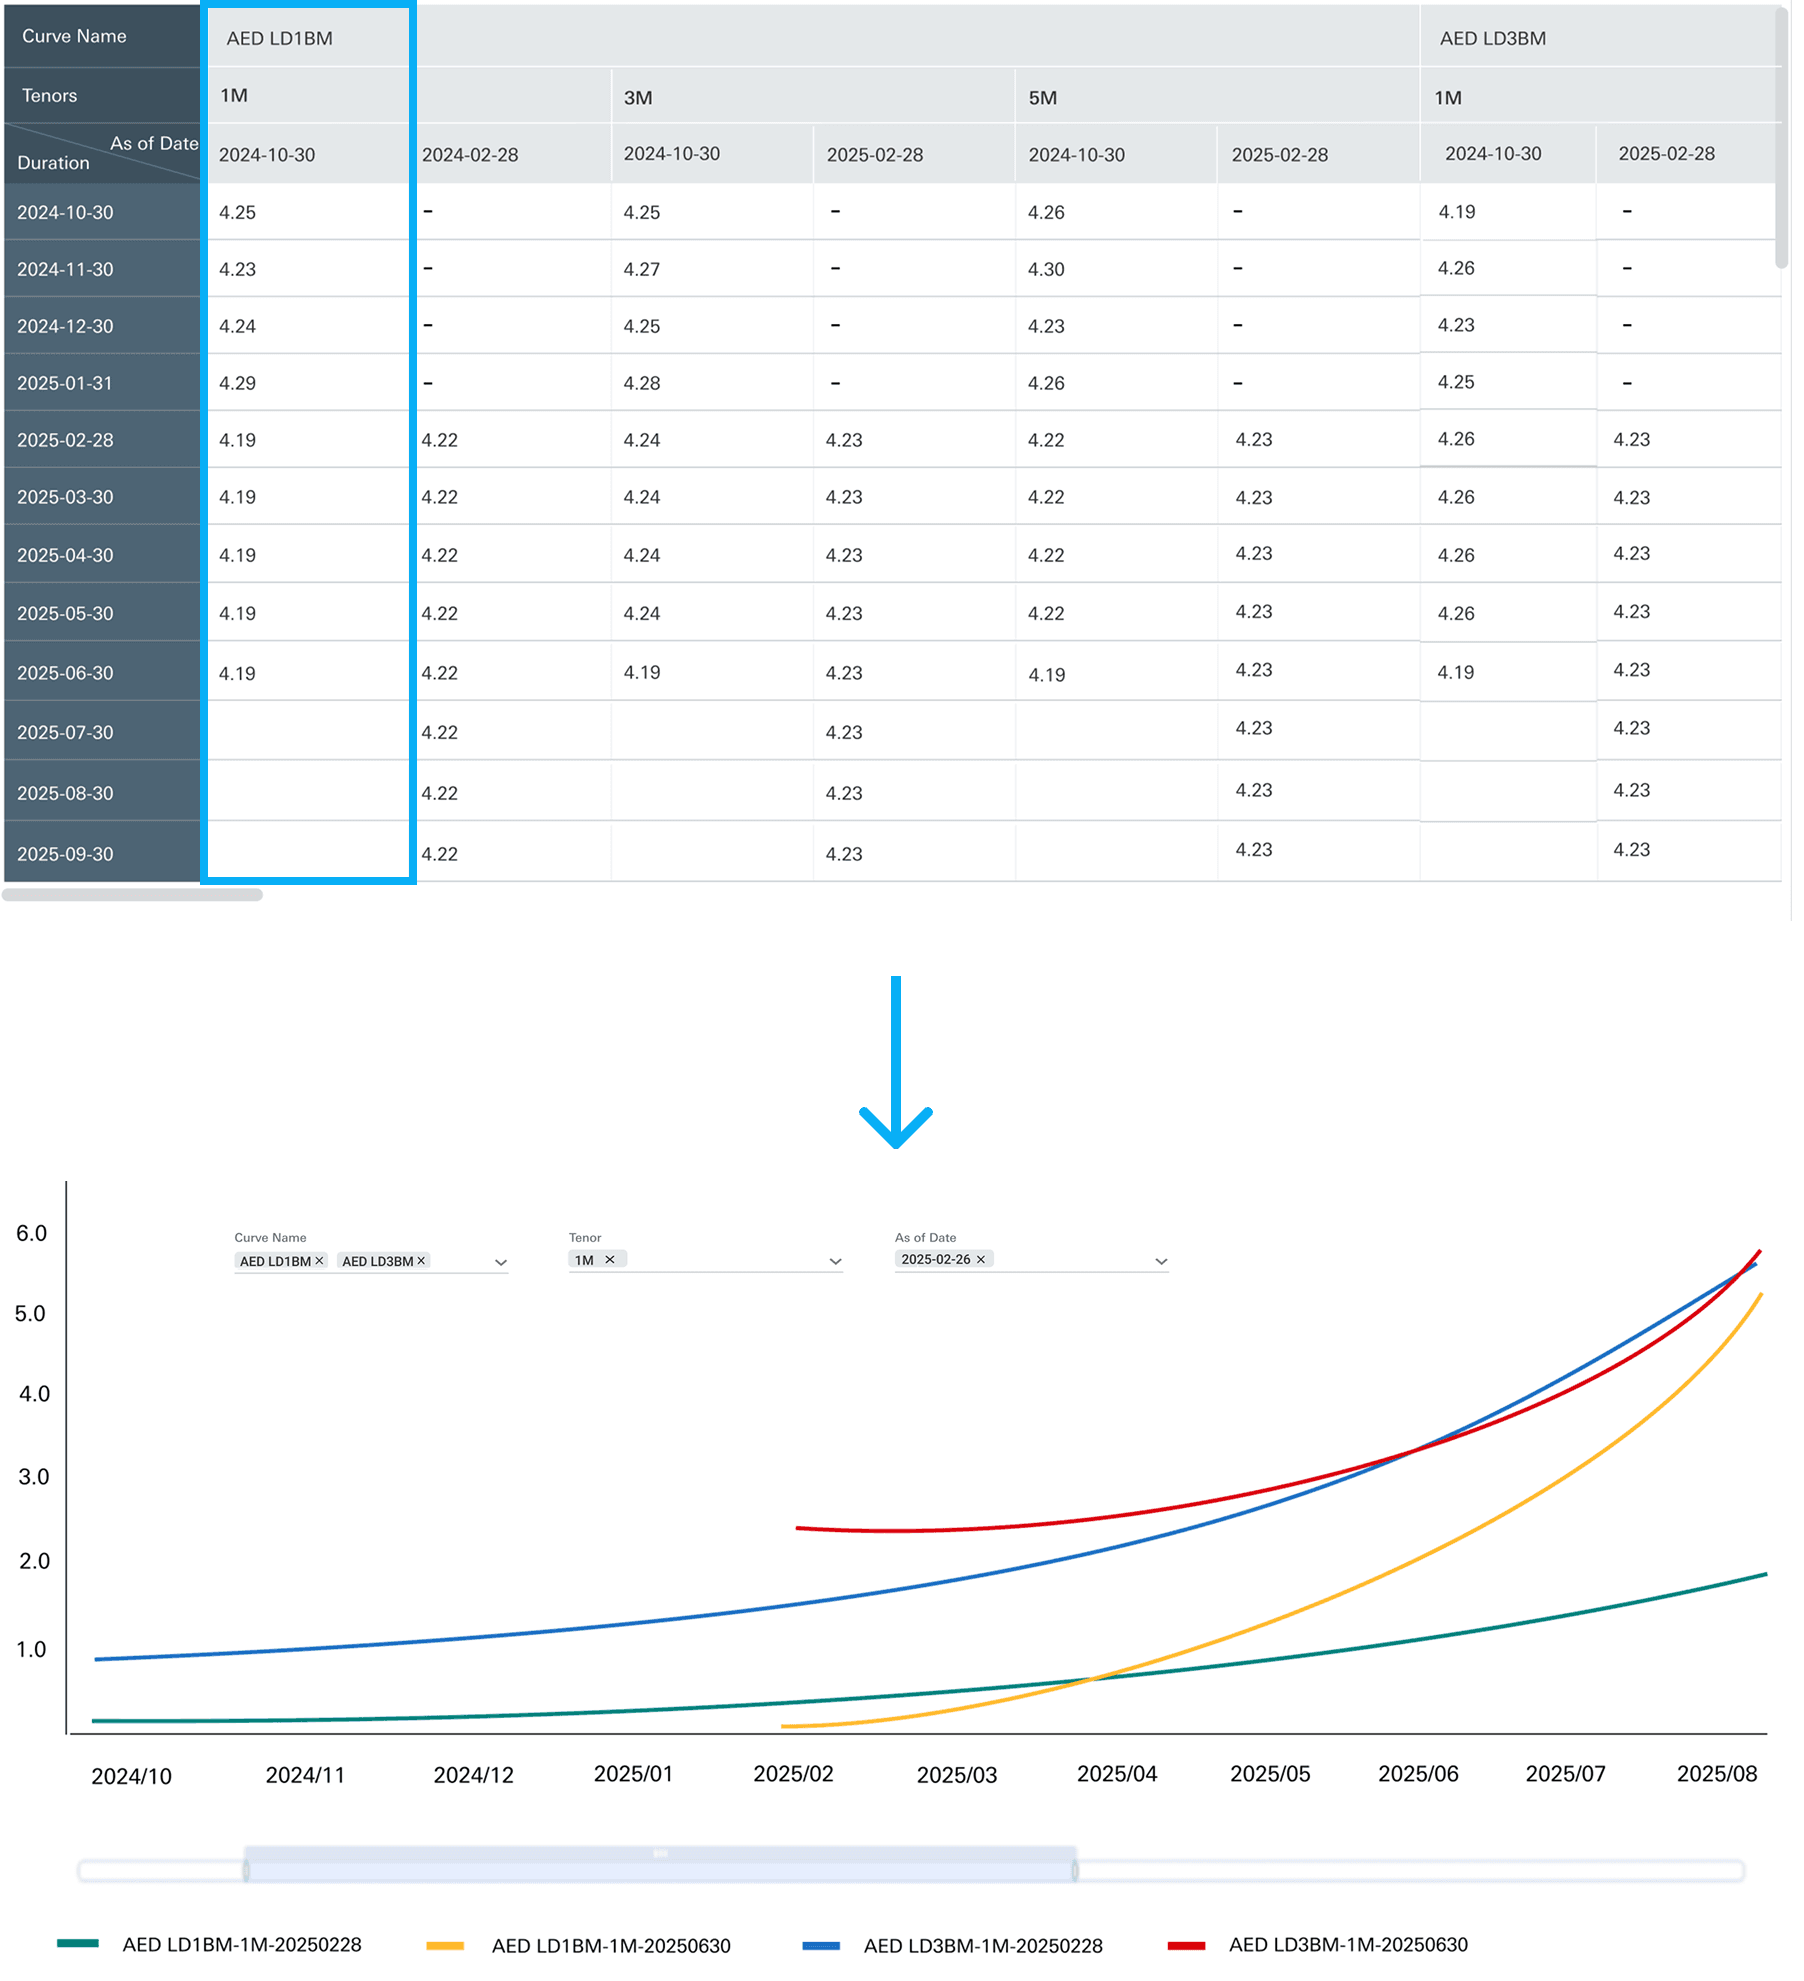
I translated complex model outputs into a structured, multidimensional table that made interest rate forecasts easier to scan and compare. To clarify the nested data structure, I used a tonal hierarchy to distinguish primary headers, secondary column headers, and row headers, helping analysts understand the relationships before reading individual values.
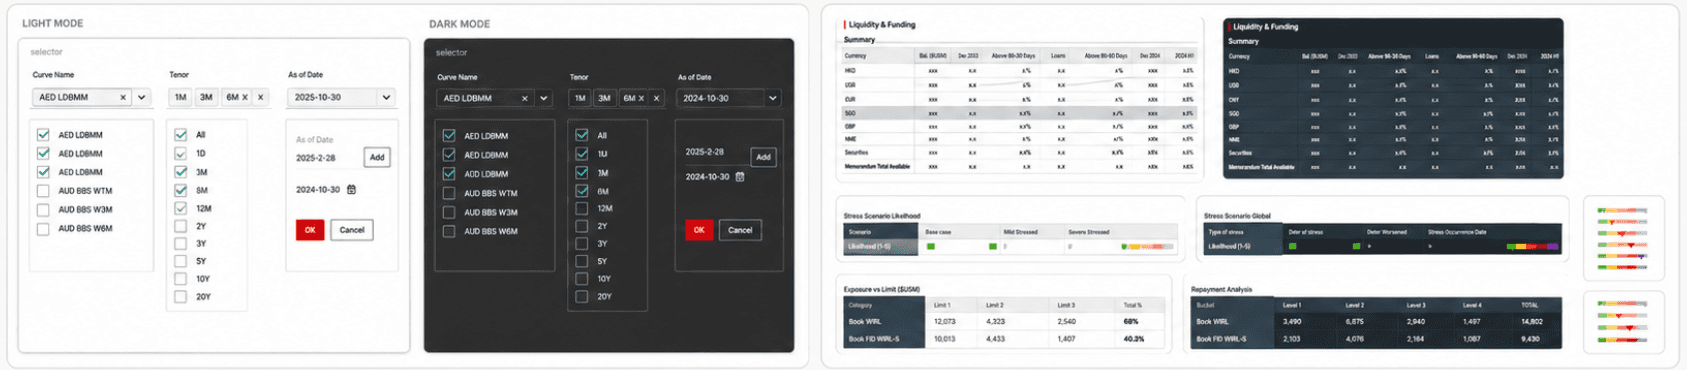
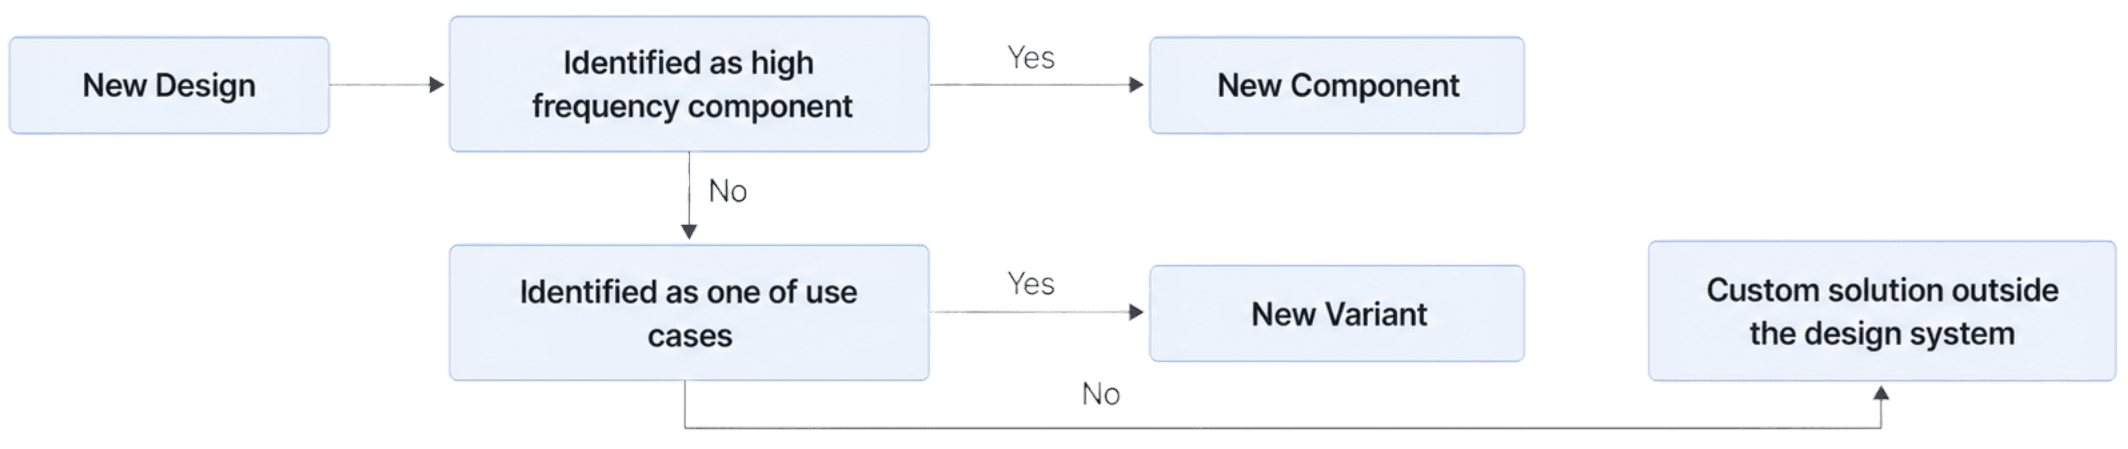
I used a simple decision process to maintain the design system.
If a pattern would be reused across workflows, it should become a component. If it was just a different state or behavior of something we already had, it should become a variant. But if it was truly business-specific and not reusable, I kept it outside the design system intentionally.
And I think that last part is important. Not everything should become part of the design system. Otherwise, the system becomes too heavy and hard to maintain. So the goal was to keep the system useful, consistent, and clean, while still supporting real product needs.
By the end of my involvement, the project had moved beyond concept. The design direction was approved by the business lead, and the technical feasibility had been validated with engineering.
The product then moved into implementation, with the goal of replacing the legacy third-party forecasting system over time.
Redefining the analyst workflow
The approved workflow changed where analysts spent their effort while keeping expert judgment and final accountability with the human.
Design System

Following financial analysts’ mental models, I mapped Duration to the X-axis and Interest Rates to the Y-axis, ensuring the visualization felt familiar and actionable.
Data visualization • Chart
Before
Legacy workflow
Step 1
Gather model inputs
Navigate fragmented legacy data
Step 2
Generate the forecast manually
Produce the initial curve
Step 3
Finalize the forecast
The analyst owns both production and the final decision
With the new platform
AI supported workflow
Step 1
AI creates the initial forecast
Repetitive upfront work is reduced
Step 2
Analyst reviews and compares
Validate scenarios and apply current market context
Step 3
Adjust and make the final decision
Human judgment remains accountable
Less time on forecast production
More time on expert judgment
The goal was not to replace analysts. It was to focus their time on the decisions where their domain expertise mattered most.
Thank you for scrolling:)
If you want to see more detail about this project, feel free to reach out!
1. Make AI forecasts understandable
Help analysts read model generated curves through structured table and chart views.
2. Support scenario comparison
Enable analysts to compare currencies, dates, tenors, and forecast scenarios before making decisions.
3. Keep analysts in control
Allow analysts to calibrate, adjust, and approve the final curve instead of relying on AI output directly.
Fintech
CLIENT:
HSBC
YEAR:
2024-2025
MY ROLE
Senior UX Designer
HSBC- AI Forecast Interest Rate
About this Project
Context
The goal of this product was to help analysts forecast future interest rate trends more efficiently and make better decisions under uncertainty.
Challenge:
First, the existing Interest rate forecasting process relied on a third-party legacy system, which cost millions of dollars every year.
Second, the overall forecasting workflow was quite inefficient. It often took a long time for financial analysts to go through the process and get a final result.
Impact:
70% faster forecasting via automated AI workflows.
50+ data sources synthesized into a unified interaction model.
90% adoption rate among institutional analysts by designing for AI explainability.
My Role: Solo designer
UX design
Documentation
Design system
Team: Design team
Business team
Data Science team
Engineering team
Product Manager
Full Story
Challenges
There were several challenges.
First, the existing solution relied on a third-party legacy system, which cost millions of dollars every year. At the same time, it raised data security concerns, since sensitive interest rate data had to go through that external system. Second, the overall forecasting workflow was quite inefficient. It often took a long time for financial analysts to go through the process and get a final result.
The business team had a vision for how analysts would work with AI. Data science had a forecasting model, and engineering understood the technical constraints. But there was no end-to-end product experience connecting the model’s outputs to the decisions analysts needed to make.
Key Decisions
We considered letting the AI model produce the final interest rate forecast automatically. It would have made the workflow faster and simpler, with fewer decisions for analysts to make in the interface.
But a forecast can have significant consequences, and the model may miss recent market context or an analyst’s domain judgment. We chose to let AI generate the initial forecast, then give analysts a way to review it, compare scenarios, adjust it when needed, and make the final decision. This added steps, but kept the reasoning visible and the analyst accountable.
Discovery Workshop with business stakeholders
I started by gathering business insights, I facilitated a series of workshops with stakeholders using FigJam so that i can create journey map based on their expectation.
Brainstorming with business stakeholders & Data Science
Once that high level interaction model was clear, I worked with business stakeholders to understand what analysts needed at each stage of the workflow. In parallel, I worked with data science and engineering to understand what the model could actually generate, what data was available, and where the technical constraints were.
Design Goals
Based on that feedback, I defined three clear design goals: make the forecast easier to read, easier to compare, and easier to validate before the analyst made the final decision.
1. Make AI forecasts understandable
Help analysts read model generated curves through structured table and chart views.
2. Support scenario comparison
Enable analysts to compare currencies, dates, tenors, and forecast scenarios before making decisions.
3. Keep analysts in control
Allow analysts to calibrate, adjust, and approve the final curve instead of relying on AI output directly.
Final Designs
Data visualization • Table
I translated complex model outputs into a structured, multidimensional table that made interest rate forecasts easier to scan and compare. To clarify the nested data structure, I used a tonal hierarchy to distinguish primary headers, secondary column headers, and row headers, helping analysts understand the relationships before reading individual values.
Data visualization • Chart
Following financial analysts’ mental models, I mapped Duration to the X-axis and Interest Rates to the Y-axis, ensuring the visualization felt familiar and actionable.
Review, Calibrate & Replace
To support Calibration, I introduced an “Enable shocks” toggle that allows advanced users to calibrate and fine-tune AI-generated curves by adjusting scenarios and methods.
User Flow for Advanced Users
Design System
I used a simple decision process to maintain the design system.
If a pattern would be reused across workflows, it should become a component. If it was just a different state or behavior of something we already had, it should become a variant. But if it was truly business-specific and not reusable, I kept it outside the design system intentionally.
And I think that last part is important. Not everything should become part of the design system. Otherwise, the system becomes too heavy and hard to maintain. So the goal was to keep the system useful, consistent, and clean, while still supporting real product needs.
Result and Impact
Delivery result
By the end of my involvement, the project had moved beyond concept. The design direction was approved by the business lead, and the technical feasibility had been validated with engineering.
The product then moved into implementation, with the goal of replacing the legacy third-party forecasting system over time.
Workflow impact
Redefining the analyst workflow
The approved workflow changed where analysts spent their effort while keeping expert judgment and final accountability with the human.
Before
Legacy workflow
Step 1
Gather model inputs
Navigate fragmented legacy data
Step 2
Generate the forecast manually
Produce the initial curve
Step 3
Finalize the forecast
The analyst owns both production and the final decision
With the new platform
AI supported workflow
Step 1
AI creates the initial forecast
Repetitive upfront work is reduced
Step 2
Analyst reviews and compares
Validate scenarios and apply current market context
Step 3
Adjust and make the final decision
Human judgment remains accountable
Less time on forecast production
More time on expert judgment
Less time on forecast production
More time on expert judgment
The goal was not to replace analysts. It was to focus their time on the decisions where their domain expertise mattered most.
The goal was not to replace analysts. It was to focus their time on the decisions where their domain expertise mattered most.
Manager feedback
“I’m thrilled to recommend Alice Bai, an outstanding UX designer whose user-centric approach and collaboration skills left a lasting impact on our team at Apex product delivery. As her line manager, I had the privilege of working closely with Alice and can confidently share for her expertise.
Alice has a rare talent for translating complex business requirement into intuitive, visually UX and UI designe solutions. Her mastery of user interview, wireframing, and interactive prototyping was instrumental in our strategic product delivery.
Beyond technical skills, Alice is an empathetic team player, she thrives in cross-functional environments, bridging gaps between design, engineering, and stakeholders with clarity and quality.”
Thank you for scrolling:)
If you want to see more detail about this project, feel free to reach out!
Fintech
CLIENT:
HSBC
YEAR:
2024-2025
MY ROLE
Senior UX Designer
HSBC- AI Forecast Interest Rate
About this Project
Context
The goal of this product was to help analysts forecast future interest rate trends more efficiently and make better decisions under uncertainty.
Challenge:
First, the existing Interest rate forecasting process relied on a third-party legacy system, which cost millions of dollars every year.
Second, the overall forecasting workflow was quite inefficient. It often took a long time for financial analysts to go through the process and get a final result.
Impact:
70% faster forecasting via automated AI workflows.
50+ data sources synthesized into a unified interaction model.
90% adoption rate among institutional analysts by designing for AI explainability.
My Role: Solo designer
UX design
Documentation
Design system
Team: Design team
Business team
Data Science team
Engineering team
Product Manager
Full Story
Challenges
There were several challenges.
First, the existing solution relied on a third-party legacy system, which cost millions of dollars every year. At the same time, it raised data security concerns, since sensitive interest rate data had to go through that external system. Second, the overall forecasting workflow was quite inefficient. It often took a long time for financial analysts to go through the process and get a final result.
The business team had a vision for how analysts would work with AI. Data science had a forecasting model, and engineering understood the technical constraints. But there was no end-to-end product experience connecting the model’s outputs to the decisions analysts needed to make.
Key Decisions
We considered letting the AI model produce the final interest rate forecast automatically. It would have made the workflow faster and simpler, with fewer decisions for analysts to make in the interface.
But a forecast can have significant consequences, and the model may miss recent market context or an analyst’s domain judgment. We chose to let AI generate the initial forecast, then give analysts a way to review it, compare scenarios, adjust it when needed, and make the final decision. This added steps, but kept the reasoning visible and the analyst accountable.
Discovery Workshop with business stakeholders
I started by gathering business insights, I facilitated a series of workshops with stakeholders using FigJam so that i can create journey map based on their expectation.
Brainstorming with business stakeholders & Data Science
Once that high level interaction model was clear, I worked with business stakeholders to understand what analysts needed at each stage of the workflow. In parallel, I worked with data science and engineering to understand what the model could actually generate, what data was available, and where the technical constraints were.
Design Goals
Based on that feedback, I defined three clear design goals: make the forecast easier to read, easier to compare, and easier to validate before the analyst made the final decision.
1. Make AI forecasts understandable
Help analysts read model generated curves through structured table and chart views.
2. Support scenario comparison
Enable analysts to compare currencies, dates, tenors, and forecast scenarios before making decisions.
3. Keep analysts in control
Allow analysts to calibrate, adjust, and approve the final curve instead of relying on AI output directly.
Final Designs
Data visualization • Table
I translated complex model outputs into a structured, multidimensional table that made interest rate forecasts easier to scan and compare. To clarify the nested data structure, I used a tonal hierarchy to distinguish primary headers, secondary column headers, and row headers, helping analysts understand the relationships before reading individual values.
Data visualization • Chart
Following financial analysts’ mental models, I mapped Duration to the X-axis and Interest Rates to the Y-axis, ensuring the visualization felt familiar and actionable.
Review, Calibrate & Replace
To support Calibration, I introduced an “Enable shocks” toggle that allows advanced users to calibrate and fine-tune AI-generated curves by adjusting scenarios and methods.
User Flow for Advanced Users
Design System
I used a simple decision process to maintain the design system.
If a pattern would be reused across workflows, it should become a component. If it was just a different state or behavior of something we already had, it should become a variant. But if it was truly business-specific and not reusable, I kept it outside the design system intentionally.
And I think that last part is important. Not everything should become part of the design system. Otherwise, the system becomes too heavy and hard to maintain. So the goal was to keep the system useful, consistent, and clean, while still supporting real product needs.
Result and Impact
Delivery result
By the end of my involvement, the project had moved beyond concept. The design direction was approved by the business lead, and the technical feasibility had been validated with engineering.
The product then moved into implementation, with the goal of replacing the legacy third-party forecasting system over time.
Workflow impact
Redefining the analyst workflow
The approved workflow changed where analysts spent their effort while keeping expert judgment and final accountability with the human.
Before
Legacy workflow
Step 1
Gather model inputs
Navigate fragmented legacy data
Step 2
Generate the forecast manually
Produce the initial curve
Step 3
Finalize the forecast
The analyst owns both production and the final decision
With the new platform
AI supported workflow
Step 1
AI creates the initial forecast
Repetitive upfront work is reduced
Step 2
Analyst reviews and compares
Validate scenarios and apply current market context
Step 3
Adjust and make the final decision
Human judgment remains accountable
Less time on forecast production
More time on expert judgment
Less time on forecast production
More time on expert judgment
The goal was not to replace analysts. It was to focus their time on the decisions where their domain expertise mattered most.
The goal was not to replace analysts. It was to focus their time on the decisions where their domain expertise mattered most.
Manager feedback
“I’m thrilled to recommend Alice Bai, an outstanding UX designer whose user-centric approach and collaboration skills left a lasting impact on our team at Apex product delivery. As her line manager, I had the privilege of working closely with Alice and can confidently share for her expertise.
Alice has a rare talent for translating complex business requirement into intuitive, visually UX and UI designe solutions. Her mastery of user interview, wireframing, and interactive prototyping was instrumental in our strategic product delivery.
Beyond technical skills, Alice is an empathetic team player, she thrives in cross-functional environments, bridging gaps between design, engineering, and stakeholders with clarity and quality.”